Simulate your business chain. Before it breaks.
Datastripes Studio models your real physical supply chain — facilities, ports, routes and chokepoints — as a geographic network. Apply a shock, and see exactly what fails and what still gets through.
The problem
A spreadsheet cannot tell you what a port closure costs.
Generic BI and dataset-analysis tools treat your supply chain as rows in a table. Datastripes Studio treats it as what it actually is: a geographic, directional network of real facilities, real routes and real chokepoints — so a shock behaves the way it would in the real world.
What it does
A digital twin of your supply chain, stress-tested on demand.
Every facility, mapped and connected.
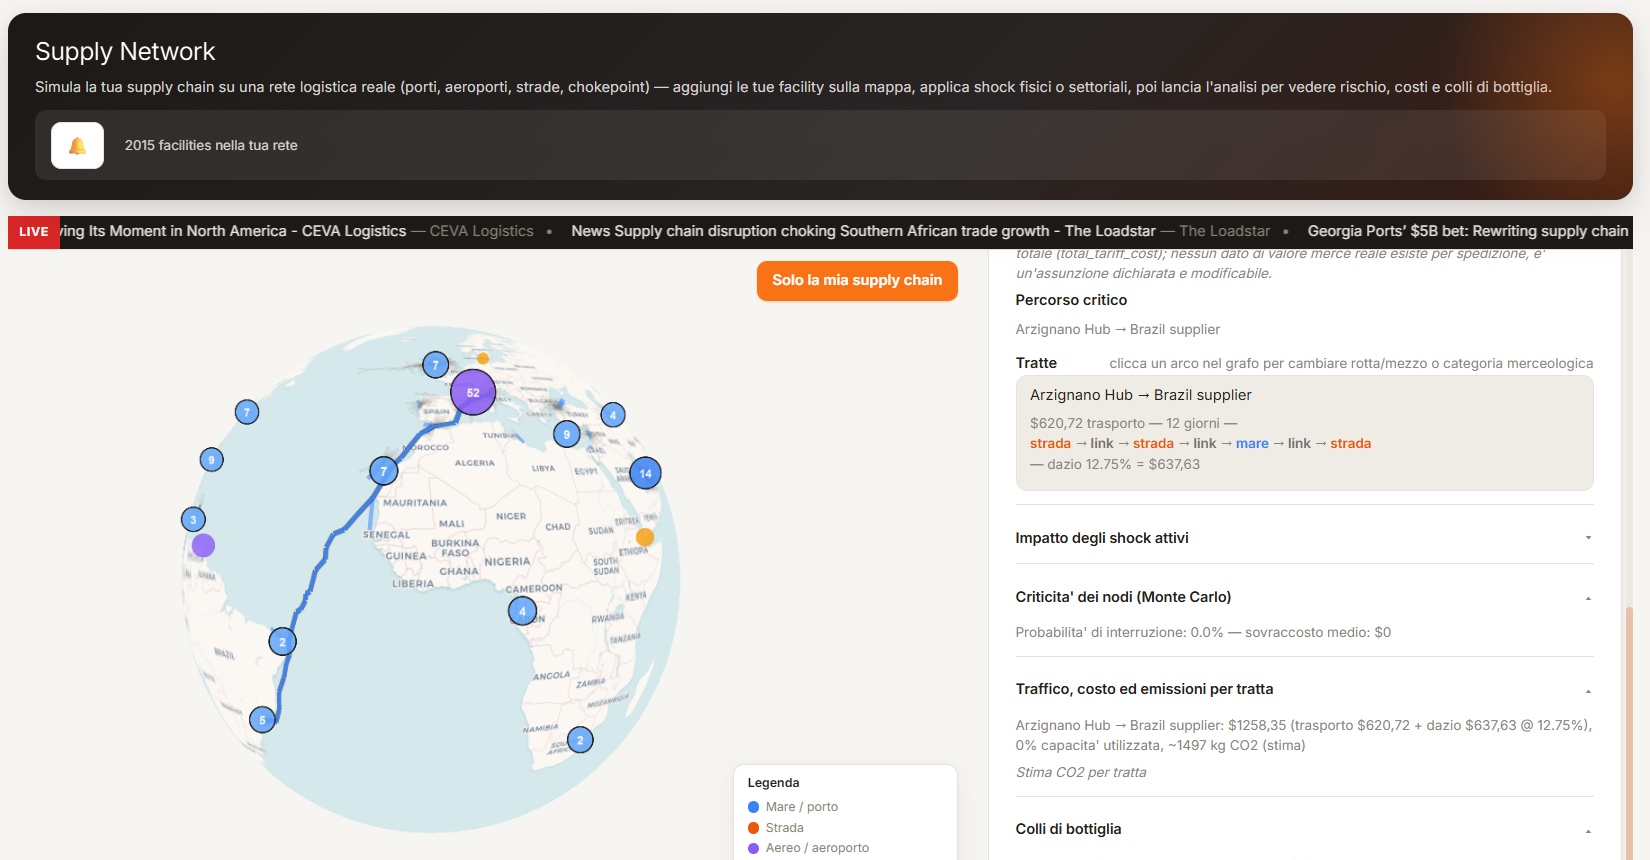
Facilities resolve to real coordinates — explicit lat/lon, geocoded address, or country-capital fallback — and are linked into a dependency graph (DAG) of who supplies whom, with a built-in guard against reversed supplier direction.
Two kinds of shock, one engine.
Physical shocks close a node, an edge, or a whole geofenced area — a strike, a flood, a blocked strait. Sector-wide shocks propagate a % impact across a country and sector through Input-Output (ICIO) data, reaching every facility that sources from it.
Official vs. alternative, scored.
Every run returns a full route breakdown — cost, time, tariffs, chokepoints and CO2 — plus node criticality and bottleneck detection, and an official-vs-alternative scorecard so rerouting is a comparison, not a hunch.
What you can ask
Ask as you would with a logistics analyst
How it works
Three steps. No GIS team required.
Load your network
Import facilities, ports and warehouses. Studio resolves coordinates and builds the dependency graph automatically.
Apply a shock
Close a node, a route, a geofenced region, or hit a whole sector with a % impact. Compare official routing against as many what-if branches as you need.
Get the breakdown
Route cost, time, tariffs, chokepoints, criticality and CO2 — as a narrated summary and a structured report you can act on.
Method and reliability
Real-world topology. Reproducible results.
Built on a real-world logistics graph — actual ports, airports, chokepoints and routes — not a generic node-edge diagram.
Your facilities, your suppliers, your routes — loaded once, reused across every scenario you run.
Every route breakdown can be reconstructed and verified. Same topology, same shock, same answer. Compliant with EU Regulation 2024/1689, Art. 50.
We finally know which supplier we can't afford to lose — before we lose it.
Data and sovereignty
Desktop-based. Your network stays yours.
Datastripes Studio runs on your own desktop. Your supplier list, facility locations and route data are never uploaded to a shared cloud.
Related
Go deeper into your supply chain.
Find your single points of failure with node criticality, chokepoint detection and live disruption alerts.
A live geographic map of every facility and route, built automatically from your data.
Compare N rerouting and shock scenarios on the same topology, side by side.
Next step
See your own network simulated.
We reply within 24 hours. Thirty minutes on your real facilities and routes.