Datastripes: No-Code Data Analysis and AI Visualization
Stop staring at endless spreadsheets.
Turn your data into visual stories and podcasts in seconds.
No Code. All Privacy.
Linked with systems all over the world
From CSV to CEO-Ready
in 3 Steps.
Connect Source
Drag and drop your CSV, Excel, or connect directly to PostgreSQL and Snowflake securely.
Stripe & Flow
Use our node-based editor to filter, stripe, and visualize data. See patterns instantly.
AI Narrate
Let AI analyze the results and generate a narrated, shareable dashboard link for your team.
Analyze. Breathe.
The old way of data analysis is dead. Meet the visual, modular, and incredibly fast approach.
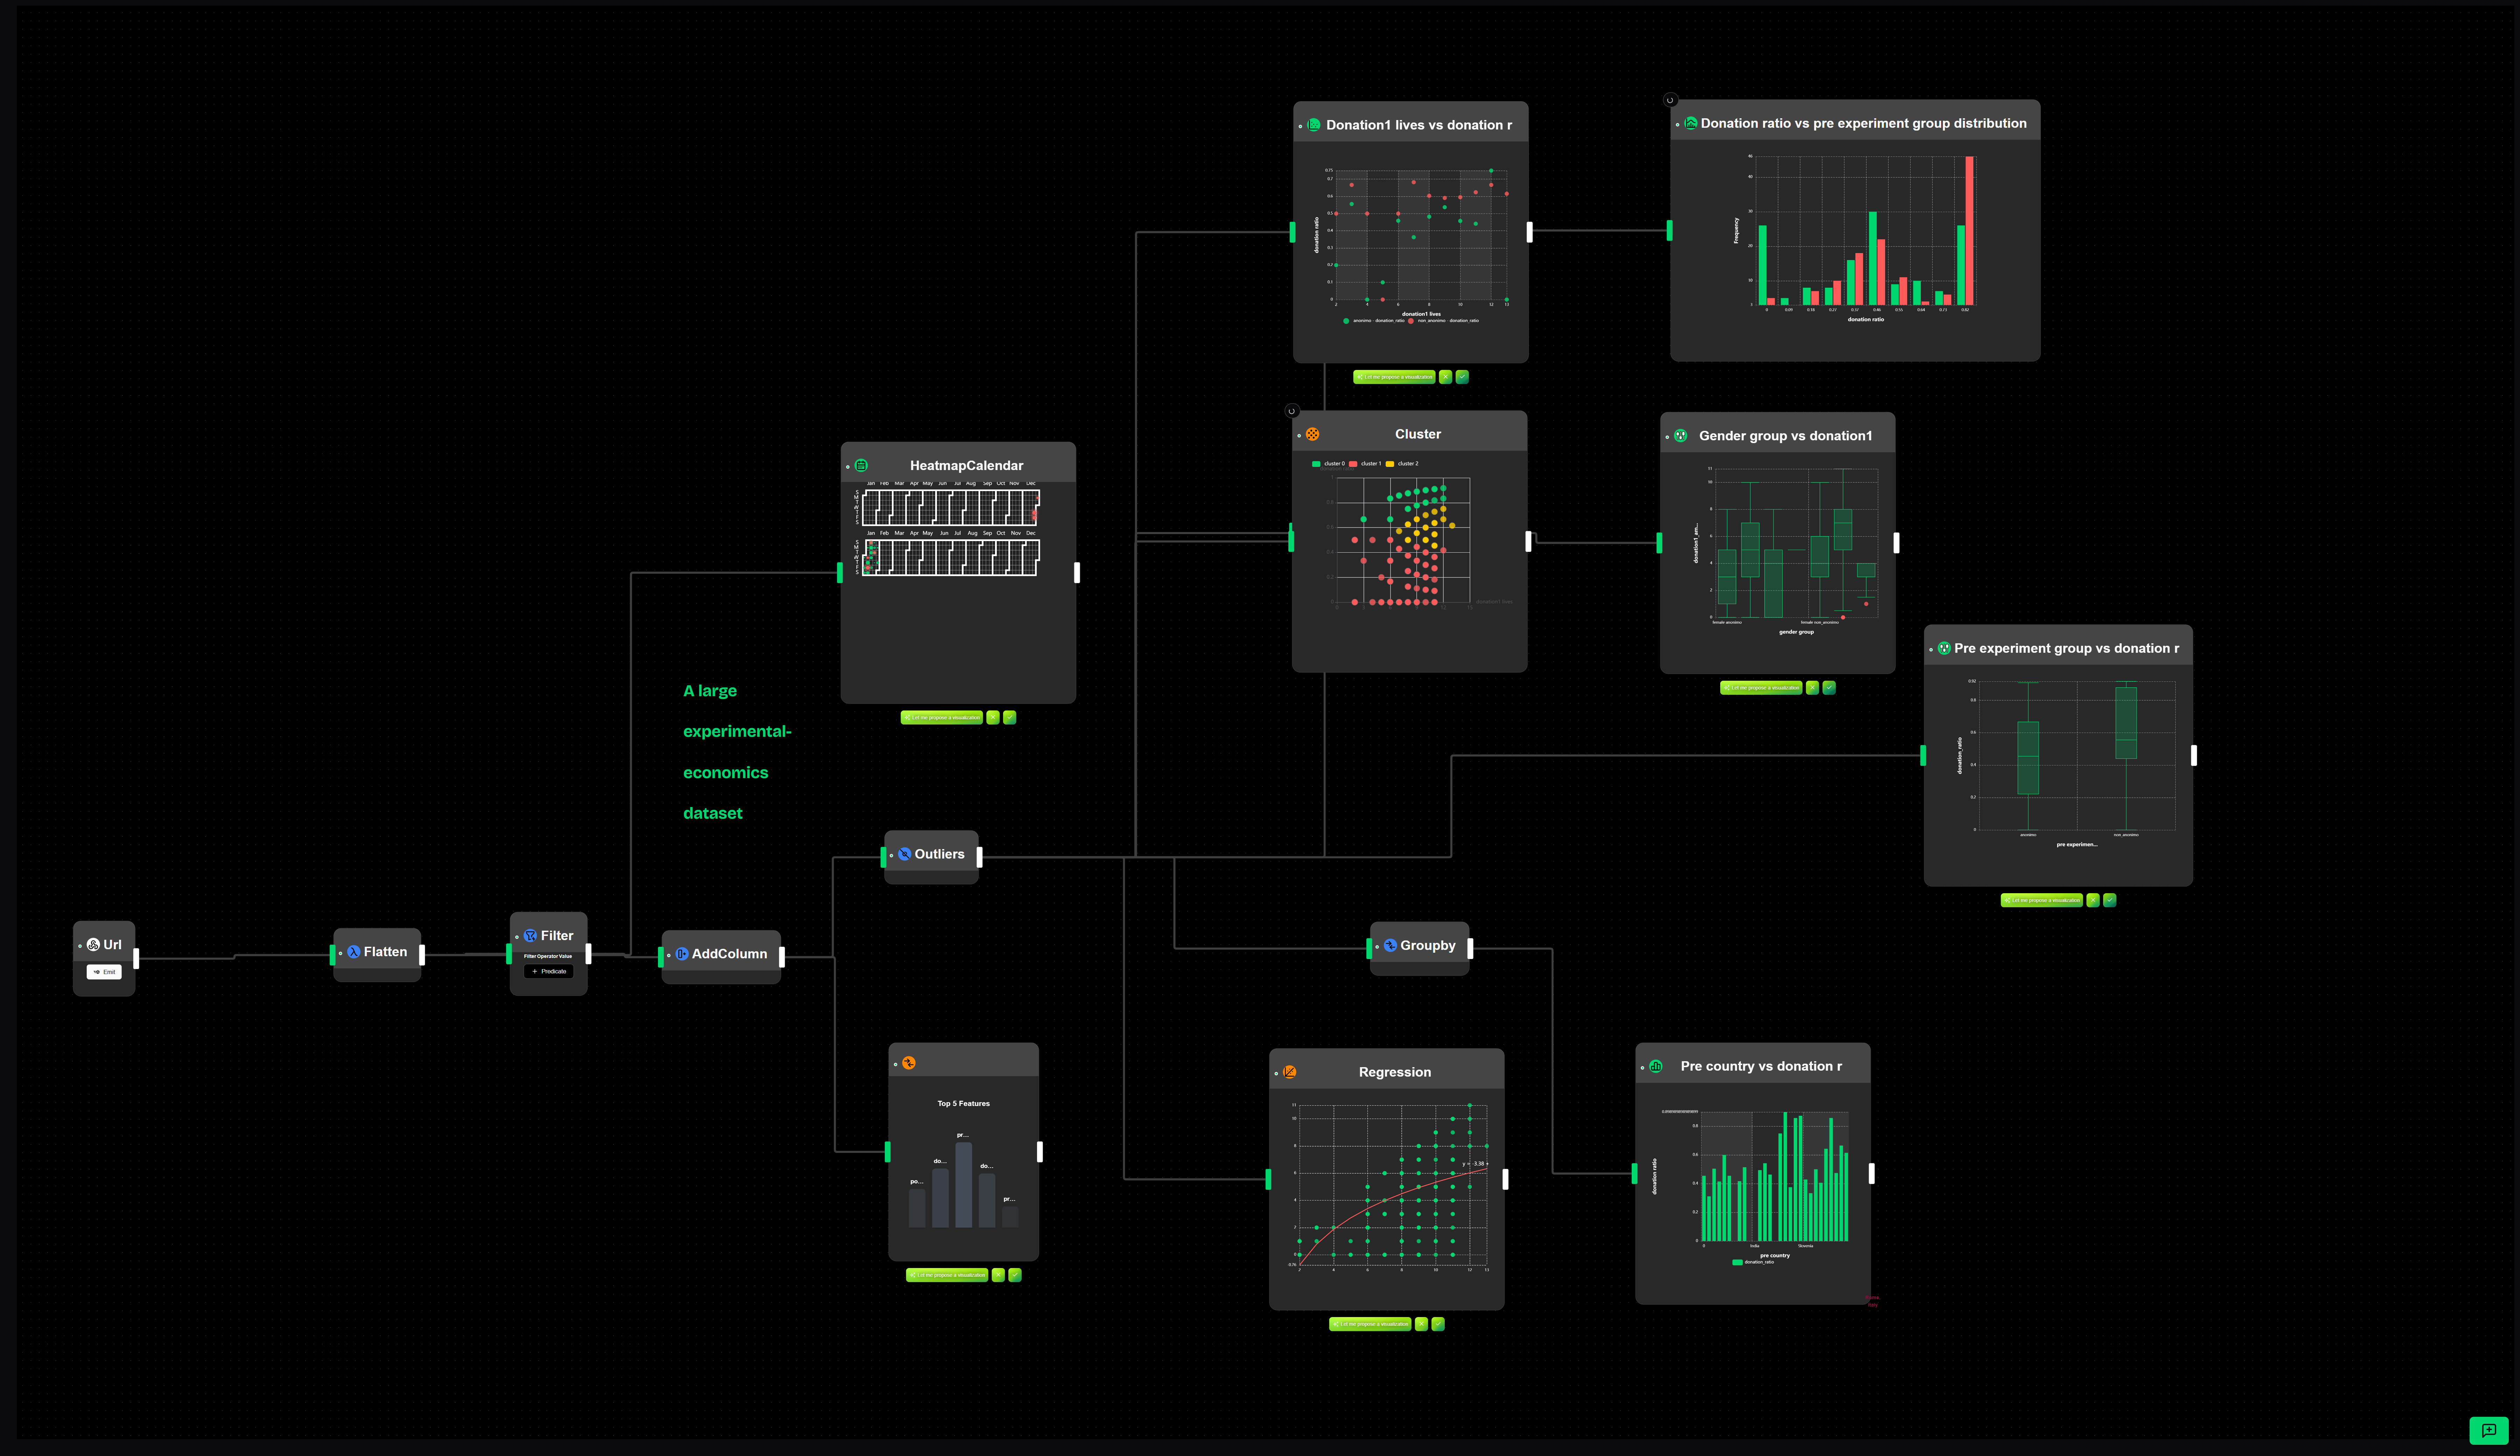
Node by Node
Build your analysis flow by dragging logic blocks. No code needed.
Connect data sources, filter rows, stripe columns, and visualize results in seconds.
Absolute Privacy
Data never leaves your device. 100% local analysis, browser speed, zero leak risk.
AI that Helps
Just ask, and AI explains hidden patterns in your numbers with natural voice.
Data to Podcasts in Seconds
Generate audio narratives from your data insights.
Share with your team or clients as engaging podcasts.
Perfect for presentations or quick updates.
Drop the file.
No slow uploads. Drag your CSV or Excel. Datastripes' local engine parses structure in milliseconds.
Connect the nodes.
Create a visual pipeline. Filter rows, group values, and calculate metrics by connecting blocks like a puzzle.
Let AI handle it.
"What's the sales trend?" Ask in natural language. Get instant charts and audio narratives.
From Static Cells to
Scenario Generation in 1 Second.
Drop your model. We instantly compile it into a UI where clients can run What-If analyses by dragging sliders. Your complex formulas power the engine behind the scenes.
Drop Financial_Model_v7.xlsx
12 Sheets, 450 Formulas Detected
Q3 Investment Scenario
Interactive Client Portal
What they say
"Its intuitive interface and powerful features make it easy to create stunning visualizations in no time. Highly recommended for anyone looking to elevate their data presentation!"
"The app is amazing and really helpful for visualising just about any data source. The UI is simple and easy to use, I am looking forward to getting more in to it as I add data from y sources."
"It allowed me to transform raw data into clear insights in seconds, making it easier to track performance, monitor objectives, and guide decisions with a structured, visual approach."
"The built-in AI found a sales correlation we had ignored for months. It paid for itself in 10 minutes."
"Zero cloud upload? For us handling healthcare data, it's the only SaaS solution approved by our legal department."
Invest in Your Presentation
Strict limits. Serious value. Upgrade when your business demands it.
Sandbox
For quick testing and self-use.
- ✓ 1000 Rows, 30 Columns
- ✓ Up to 10 Sheets
- ⚠️ 48-Hour Temporary Sharing (Links expire, forcing re-upload)
Enthusiast
For professionals managing multi-client reporting.
- ✓ 5000 Rows, 100 Columns
- ✓ Up to 20 Sheets
- ✓ 7-Day Link Expiry
Pro Partner
For individual power users with medium datasets.
- ★ Permanent, Stable Client Links
- ★ White-label Custom Branding
- ★ 25,000 Rows, 100 Columns
- ★ Up to 50 Dependent Sheets
- ★ Manage Unlimited Clients
Our strict link-expiry on Free/Enthusiast tiers protects server bandwidth and ensures high-performance calculation loads for our Pro Partners.


 #1 Product of the Day