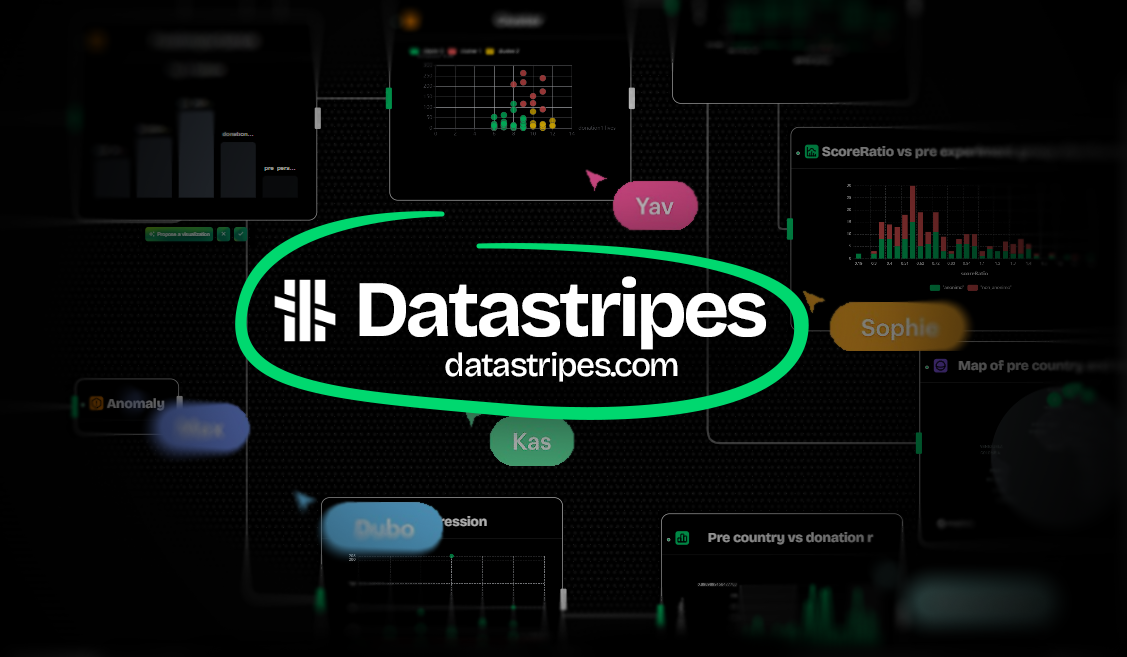
Beyond Dashboards: How AI Is Changing Business Intelligence (2026)
For years, Business Intelligence tools have focused on one thing:
showing what already happened.
Charts.
Reports.
Dashboards.
KPIs.
Most analytics platforms are still designed around static reporting workflows where teams manually configure charts, build filters, and spend hours preparing datasets before insights even appear.
But modern teams need something different.
They need analytics systems that:
- understand datasets automatically
- generate insights instantly
- surface anomalies in real time
- assist exploration with AI
- reduce the time between raw data and decisions
This is where Datastripes takes a different approach.
Instead of treating dashboards as static outputs, Datastripes treats analytics as a live, intelligent workspace built directly around spreadsheets, widgets, and smart analysis.
From Blank Dashboards to Automatic Analysis
Traditional BI tools usually start from an empty canvas.
You upload data.
Then manually:
- create charts
- configure filters
- define metrics
- assemble dashboards
- build reports
Datastripes removes most of this friction.
Upload:
- CSV files
- Excel sheets
- SQL datasets
- API responses
and the platform automatically analyzes the structure of the data to generate:
- dashboards
- KPI widgets
- trend analysis
- forecasts
- anomaly detection
- interactive visualizations
Instead of starting from zero, users start from working analytics immediately.
Smart Analysis Built Into The Spreadsheet
Datastripes is built around the idea that spreadsheets are still the natural interface for business data.
But spreadsheets alone are no longer enough.
The platform combines:
- sheets
- widgets
- AI analysis
- dashboards
- live collaboration
inside a single browser-native environment.
As users interact with datasets, Datastripes continuously analyzes:
- numerical relationships
- categorical distributions
- trends
- correlations
- outliers
and automatically suggests relevant visualizations and insights.
The goal is reducing the manual effort traditionally required in analytics workflows.
AI That Understands Your Data
Most AI features inside analytics tools still feel disconnected from the workflow itself.
Datastripes integrates AI directly into exploration and analysis.
The platform can:
- explain anomalies
- summarize datasets
- generate insights
- suggest visualizations
- detect trends automatically
- help users explore patterns interactively
Instead of manually searching for insights, users collaborate with the system itself.
Analytics becomes conversational and adaptive instead of static and configuration-heavy.
Interactive Widgets Instead of Static Reports
Traditional dashboards are often passive.
Datastripes focuses on interaction.
Widgets are fully connected across the workspace: selecting one chart automatically filters related visualizations and metrics.
Users can:
- drill into segments
- explore trends
- investigate anomalies
- compare scenarios
- forecast outcomes
in real time directly from the browser.
The experience feels closer to interacting with a live analytical system than reading static reports.
Faster Iteration for Modern Teams
Most teams don't have weeks to build analytics infrastructure.
They need answers immediately.
Datastripes is designed for:
- startups
- product teams
- operators
- analysts
- agencies
- founders
Teams that work directly with spreadsheets and APIs and need analytics that move at the speed of the business itself.
Browser Native Analytics
Datastripes runs directly inside the browser.
Most rendering and computation happen locally whenever possible.
This enables:
- faster interactions
- lower infrastructure overhead
- improved privacy
- local-first workflows
- real-time responsiveness
Your datasets remain under your control instead of being fully centralized externally.
The Shift Happening In Business Intelligence
The future of Business Intelligence is not:
- more dashboards
- more manual configuration
- more reporting layers
The future is intelligent analytics systems that:
- understand data automatically
- generate insights continuously
- adapt to user behavior
- reduce operational friction
Datastripes is built around this shift.
Instead of forcing users to build analytics manually from scratch, the platform transforms raw datasets into interactive analytical workspaces automatically.
The result is faster decisions, faster exploration, and a completely different relationship with data.
Why This Matters
The companies that move fastest today are not necessarily the ones with the largest datasets.
They are the ones that can:
- understand information quickly
- identify anomalies early
- iterate faster
- collaborate around insights in real time
Analytics is no longer just reporting.
It is becoming an active layer of decision making.
Datastripes is designed for that new generation of intelligent analytics workflows.