
The secret to stress-free data visualization in Tableau
No matter how powerful your visualization tool is, if your data is a mess, your insights will be too.
If you're a regular user of Tableau, you know that the quality of your visualizations is only as good as the quality of your data. But preparing that data can be a nightmare, especially when you're dealing with messy Prep flows in the Data Source tab. The solution? Clean your data before it ever reaches Tableau.
The Common Data Villain: The Date Column
The biggest enemy of any data analyst is the Date column. You know the drill: you import a dataset into Tableau, and suddenly your time-series charts are broken because:
- Some dates are "DD/MM/YYYY" (European style).
- Others are "MM-DD-YYYY" (US style).
- Some are just text strings like "Jan 12, 2024".
Fixing this inside Tableau usually requires writing complex parsing functions, creating rigid formulas, or manually editing cells in Excel. It is error-prone and boring.
Datastripes Approach: "Accept Everything, Output One"
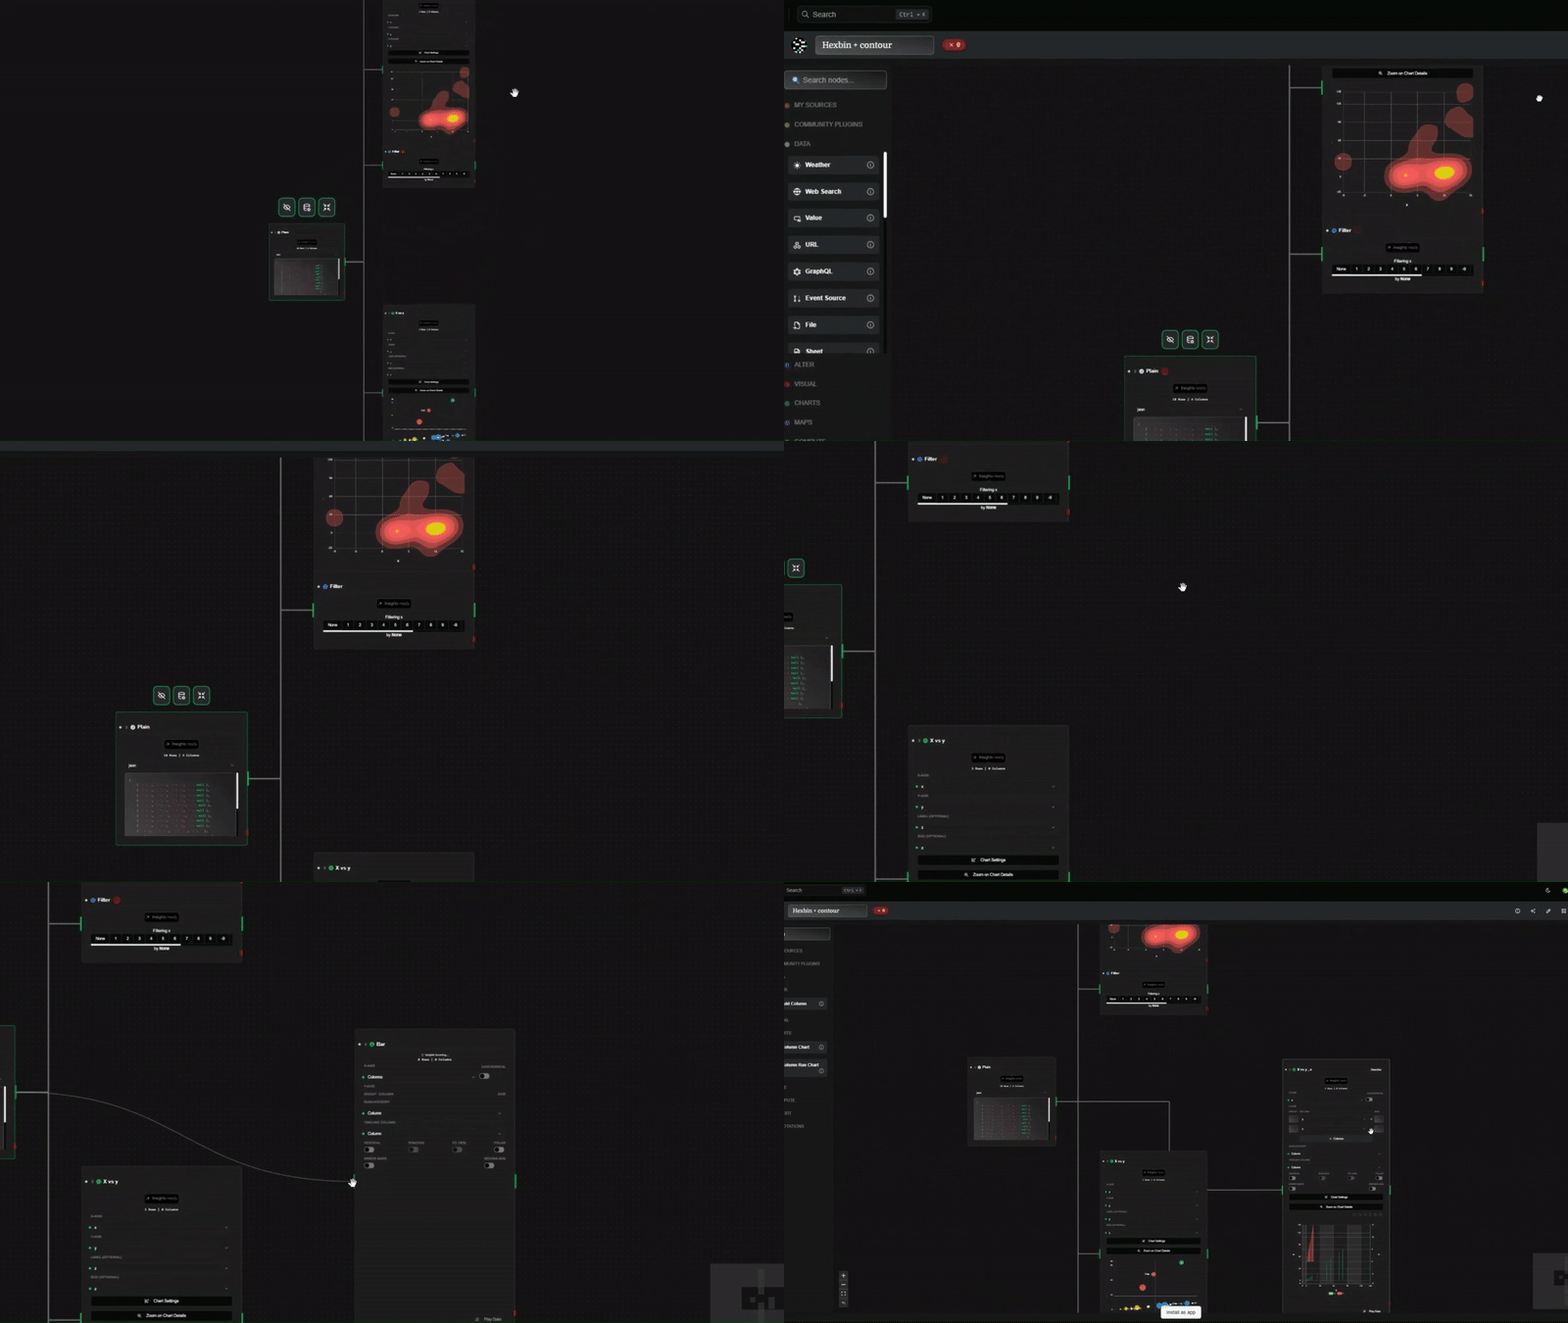
Datastripes takes a radically different approach to data cleaning, especially for timestamps.
Instead of asking you to write code to define the date format, Datastripes uses a smart ingestion engine that accepts mixed formats automatically.
- Ingest: You drop your raw hyper or CSV file. Datastripes detects the Date column, even if it contains 5 different formats mixed together.
- Standardize: The system automatically converts everything into a single, universal standard (ISO 8601).
- Visual Check: You see a timeline distribution immediately. If there are outliers (e.g., a date in the year 2099), you spot them visually and filter them out with a click.
You don't worry about how the date is written. You just know that what comes out is a clean, sortable timestamp.
Expanding Beyond Dates: A Visual Pipeline
It's not just about dates. By using a visual node-flow before sending data to Tableau, you can:
- Deduplicate rows based on IDs without writing SQL.
- Group categories (e.g., turning "USA", "U.S.", and "US" into "United States") via a simple interface.
- Filter outliers visually using histograms.
Try it out
Stop wrestling with messy CSVs and complex scripts. Clean your data visually in minutes, then export it ready for Tableau.
Try Datastripes for free and see your data clearly for the first time.