How to create a Beeswarm Plot without coding
A Beeswarm Plot is a type of scatter plot that displays individual data points along a single axis, with points arranged to avoid overlap. This visualization is particularly useful for showing the distribution and density of data points in a dataset.
That makes it the right fit for distribution analysis — but the wrong tool for the job is usually a histogram, which bins your data into buckets and hides every individual outlier salary or transaction inside an average.
Why Excel can't make this chart
A Beeswarm Plot in Excel is almost impossible, requiring custom scripts and a lot of tweaking. In practice: you either hunt for a plugin that may not survive the next Excel update, or you rebuild the whole thing by hand every time the data changes. BI tools like Looker, Power BI, and Tableau treat it the same way — a "power user" feature gated behind a calculated field or a coding step.
A worked example
an HR analyst plotting every employee's salary along one axis to spot clusters, gaps, and the handful of outliers a histogram would have smoothed away.
That's the kind of insight a bar chart or a pivot table hides and a Beeswarm Plot surfaces instantly.
Making one in Datastripes
- Upload your CSV, Excel, or JSON file — it's parsed locally in your browser, nothing is sent to a server.
- Pick Beeswarm Plot from the chart library; Datastripes suggests which of your columns fit it based on their type (categorical, numeric, time, hierarchy).
- Adjust colors, labels, and filters with live preview — no recompiling, no "update the range and re-plot."
- Export as an interactive link, an embeddable iframe, or an editable PowerPoint slide.
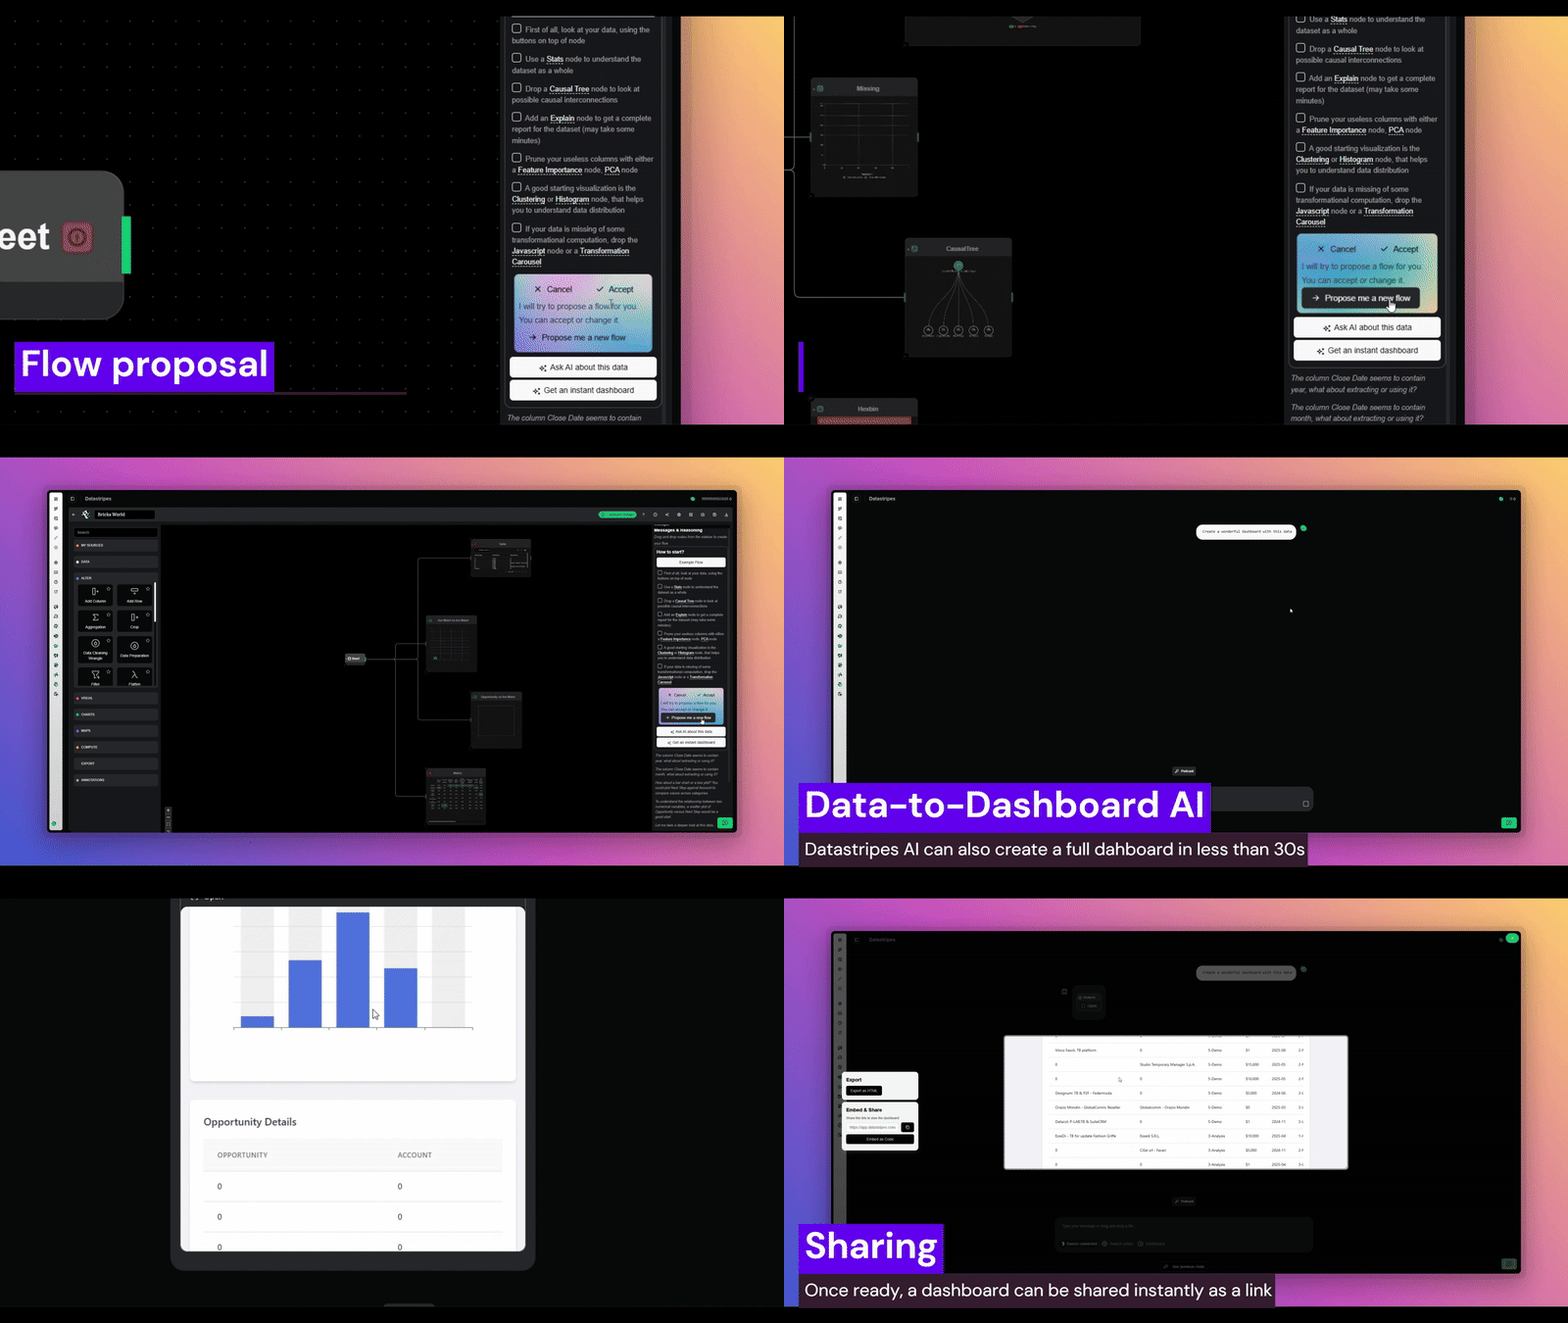
No plugin, no calculated field, no Python script — just the chart, built from the data you already have.
Create your Beeswarm Plot now and see distribution analysis the way it's meant to be seen.