Methodology and data sources
Every capability in Datastripes traces to a public data source or a named method. This page lists both, with what each covers and where it stops.
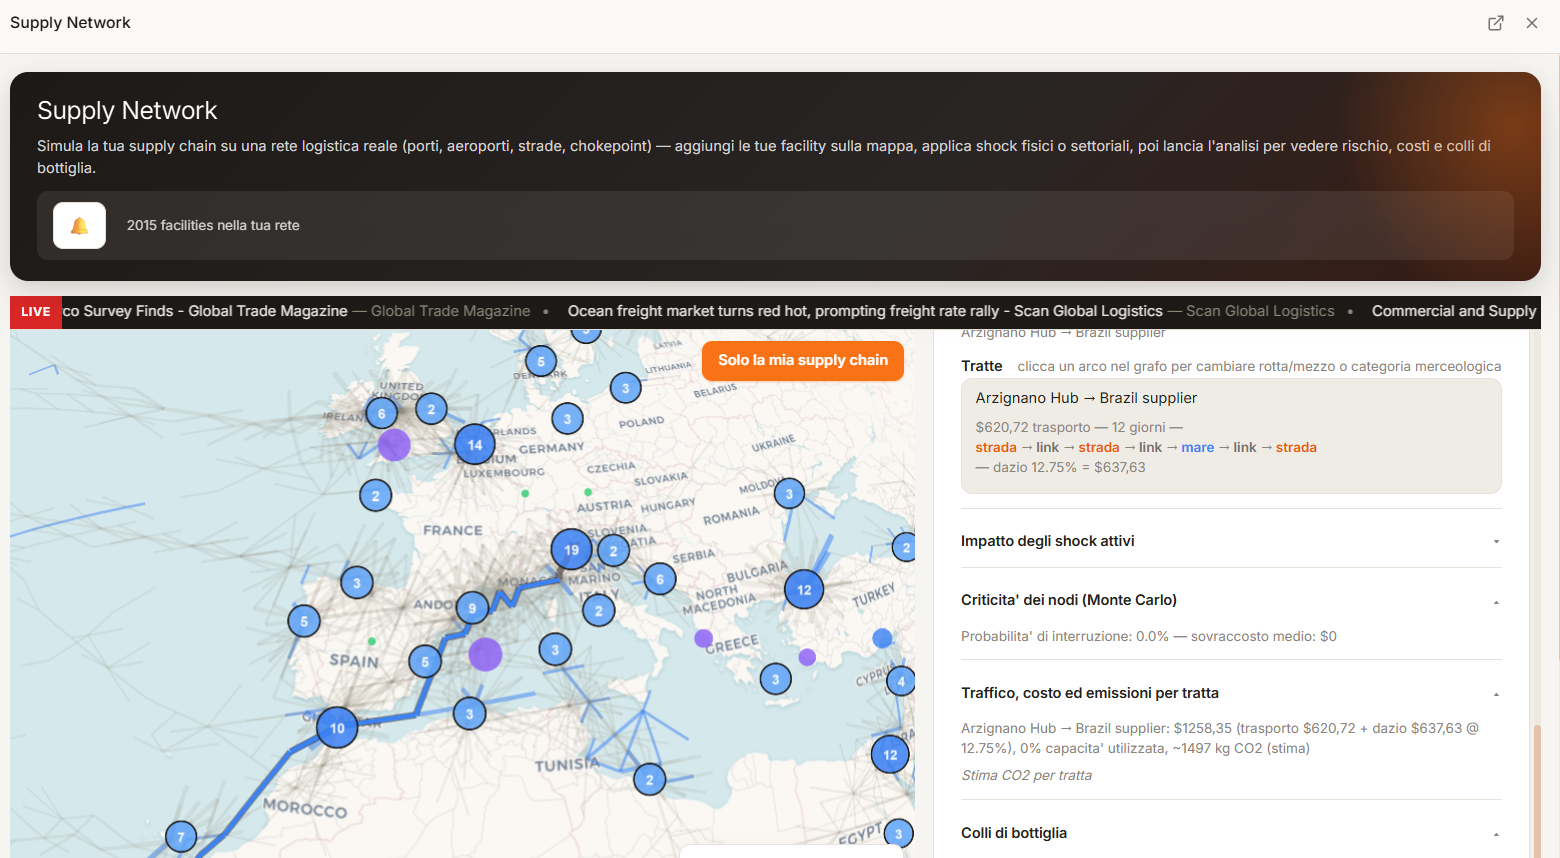
Datastripes is a supply-chain risk analysis tool that runs in your browser. It does not use proprietary or undisclosed data. This page documents the public datasets behind each figure and the quantitative methods used to combine them, so any number the tool produces can be traced and checked.
Data sources
The public datasets
Applied tariffs
MFN and preferential duty rates at HS-6, matched to components by product code and origin. Updated on a lag; does not capture every AD/CVD order or quota.
Input-output shares
Inter-country input-output tables used to infer likely upstream (tier-2, tier-3) input dependencies by sector and country.
Vessel transits
Near-real-time vessel-transit counts vs baseline for major maritime chokepoints and ports.
Legal entities & ownership
Legal Entity Identifier records and published parent relationships, used to trace supplier ownership to an ultimate parent.
Restricted-party lists
Entity List, Denied Persons List, Military End User list, Unverified List — snapshots used for first-pass screening.
Disclosed relationships
10-K and related filings mined for disclosed supplier and customer relationships.
Natural-hazard events
Global Disaster Alert and Coordination System categories used to build physical disruption scenarios.
Reference rates
Euro reference exchange rates for multi-currency landed-cost and margin reporting.
Methods
The named methods
Disruption-risk score
Disruptions are sampled across the network and propagated through the routed cost and lead-time model over many iterations, producing a probability-weighted risk score and ranked drivers. Assumptions are shown on screen.
Input-output cost-push
A Leontief input-output model propagates a cost shock (a tariff, a commodity move) through inter-sector dependencies to a landed-cost impact.
Forecasting
Damped-trend exponential smoothing for demand and price series feeding scenario and safety-stock calculations.
Buffer optimisation
Service-level-based safety-stock formulas to size buffers against lead-time and demand variability.
Concentration
Sum of squared supplier spend shares, per category and overall, alongside single-source counts and geographic convergence.
Criticality
Node criticality is computed from position in the dependency graph — downstream dependents and whether a viable alternate path exists.
Limits
What this is not
Datastripes models a network and quantifies exposure. It is not a real-time track-and-trace system, a 24/7 control tower, or a system of record. Inference-based n-tier mapping gives the shape and probable concentrations of your sub-tiers, not a verified plant-level roster. Sanctions screening is a first-pass check against a subset of public lists, not a licensed denied-party solution or legal advice. Tariff figures are planning estimates; confirm exact rates with a customs broker.
Data and privacy
Nothing you enter is uploaded.
Your supplier list, bills of materials and costs are stored locally in your browser. No account. No upload. Read how that works.
Methods: Monte-Carlo disruption modelling · Leontief input-output cost-push · damped-trend forecasting · safety-stock optimisation. See Methodology & data sources.
Questions
People also ask
- How is the supply-chain disruption-risk score calculated?
- By Monte-Carlo simulation: disruptions are sampled across your network and propagated through a routed cost and lead-time model over many iterations. The output is a probability-weighted score with the largest contributing drivers ranked.
- Does Datastripes use any private or paid data?
- No. All data is public: World Bank, OECD, IMF, GLEIF, US BIS, SEC, GDACS and the ECB.
- How current is the tariff data?
- World Bank WITS applied-tariff data is updated on a lag and does not capture every anti-dumping order, safeguard or same-week announcement. It is a planning estimate.
- What is OECD ICIO?
- The OECD Inter-Country Input-Output tables — a matrix of how much each industry in each country buys from every other industry. Datastripes uses it to infer likely sub-tier input dependencies.
Next step
See the method in the tool
Your data stays in your device! No account, no upload, no sales call.
Analyse your business chain — it's free!