N-tier supply-chain mapping
Everyone sells sub-tier visibility through a data consortium you have to join. You can also infer the shape of your tier-2 and tier-3 dependencies from the economics and public disclosures — useful, free, today.
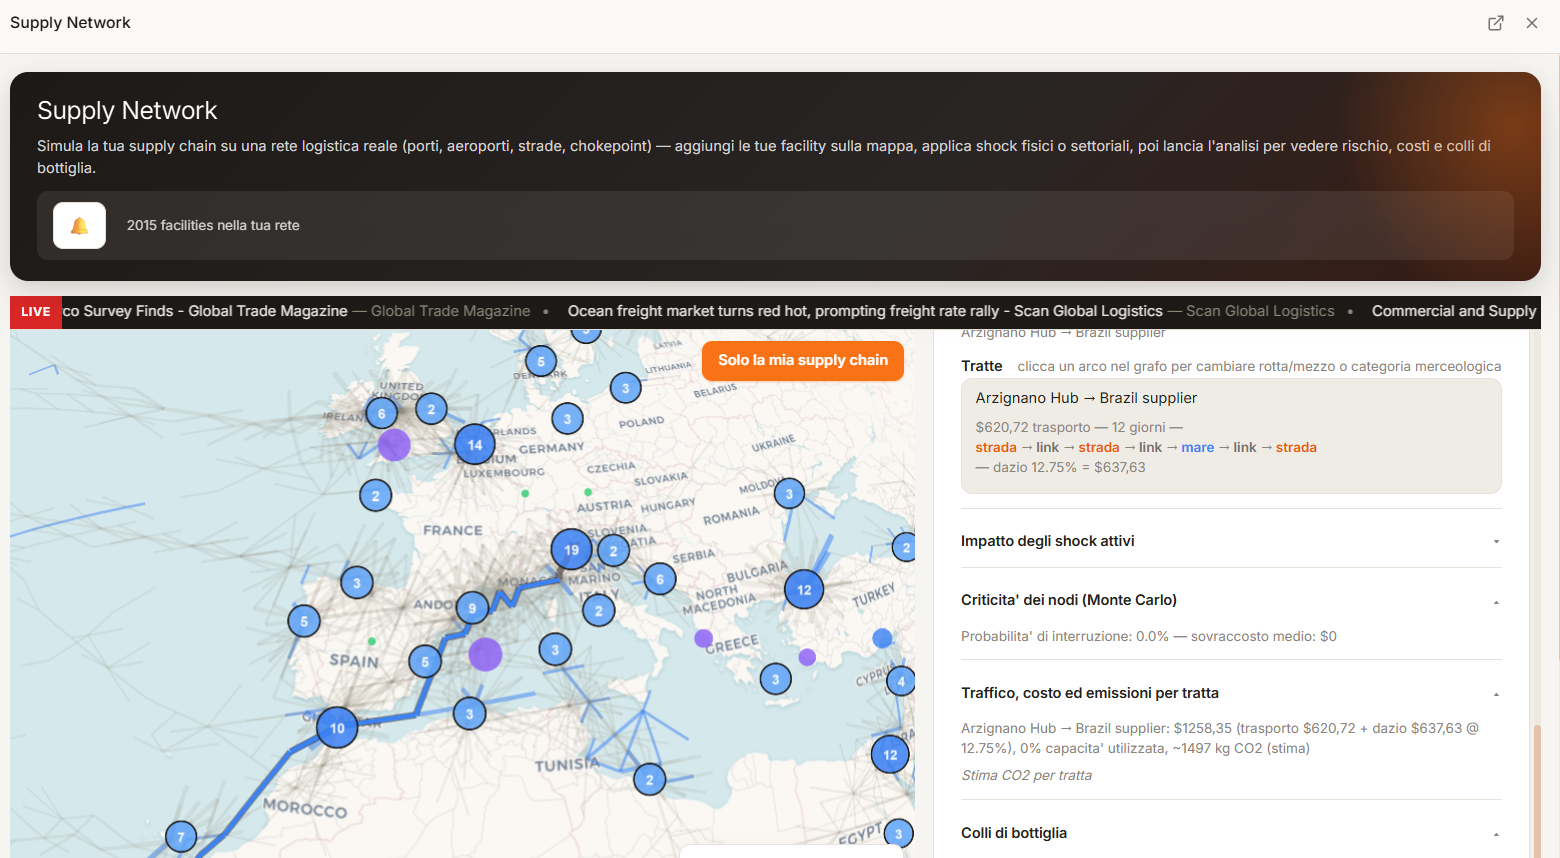
This n-tier supply-chain mapping tool runs in your browser. Starting from your direct suppliers, Datastripes extends the map upstream using OECD ICIO input-output shares and downstream relationships disclosed in SEC filings, then shows a sector-dependency heatmap so you can see where a tier-2 or tier-3 concentration sits.
The gap
Why tier-1 visibility isn't enough
Most disruptions that surprise a company happen below tier 1 — a sole-source resin plant, a single wafer fab, one smelter. You know your direct suppliers; you rarely know theirs. Consortium data fills that gap when every supplier participates, which they don't.
Inference is the complement: the structure of an economy tells you which inputs a supplier in a given sector and country almost certainly depends on, and public filings name specific relationships.
Two ways to see deeper
Consortium data vs inference
Extend a tier from OECD ICIO
Given a supplier's sector and country, the OECD inter-country input-output table gives the share of each upstream input — enough to place likely tier-2 dependencies.
Named relationships from SEC filings
Datastripes searches 10-K and related filings for disclosed supplier and customer relationships and adds the ones it finds.
Sector-dependency view
A heatmap of which upstream sectors and regions your chain leans on, aggregated across all paths.
What inference can't tell you
It gives you the shape and the probable concentrations, not the name and address of every tier-3 plant. The tool is explicit about which is which.
How it works
Build up, then look up
Load tier-1
Add your direct suppliers with sector and country. Stored locally.
Extend upstream
Datastripes applies OECD ICIO shares to project tier-2 and tier-3 input dependencies.
Overlay disclosures
Named relationships from SEC filings are merged in, and the heatmap highlights concentrations.
Data and privacy
Nothing you enter is uploaded.
Your supplier list, bills of materials and costs are stored locally in your browser. No account. No upload. Read how that works.
Methods: Monte-Carlo disruption modelling · Leontief input-output cost-push · damped-trend forecasting · safety-stock optimisation. See Methodology & data sources.
Questions
People also ask
- How do you map an n-tier supply chain without supplier cooperation?
- By inference: OECD input-output data gives the likely upstream inputs for a supplier's sector and country, and SEC filings disclose specific named relationships. It produces the shape of your sub-tiers, not a full plant-level roster.
- What is the difference between this and a consortium like a data-sharing network?
- A consortium gives verified, named sub-tier suppliers but only where every party participates and pays. Inference is free, immediate, and works for any chain, at the cost of precision.
- What data sources are used?
- OECD ICIO inter-country input-output tables and SEC EDGAR filings.
- Does my supplier list leave my device?
- No. Mapping runs in your browser against downloaded public data.
Related
Keep going
Score the concentration the n-tier map reveals with the Herfindahl index.
See which chokepoints your sub-tier routes depend on.
How OECD ICIO shares and SEC filing extraction work.
Next step
Map your n-tier dependencies
Your data stays in your device! No account, no upload, no sales call.
Analyse your business chain — it's free!