Tariff exposure calculator
Answer one question concretely: what does this duty do to my cost? Per lane, per product, with the tariff basis shown — built on World Bank WITS applied-tariff data.
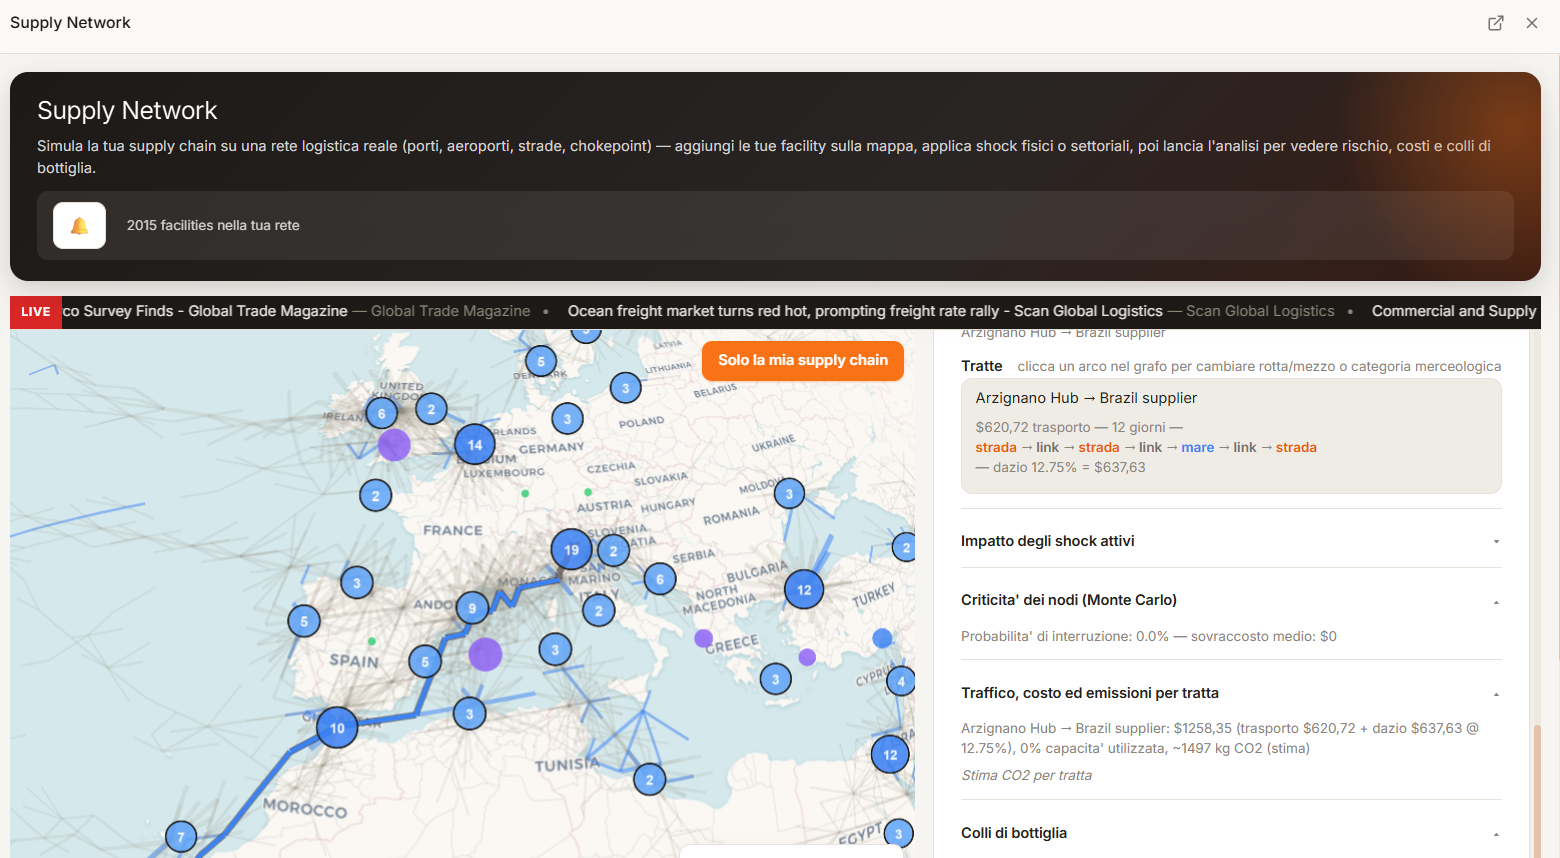
This tariff exposure calculator runs in your browser. Map a product's components to their countries of origin and Datastripes looks up the applied MFN and bilateral duty for each segment, then shows the tariff cost per segment and on total landed cost. Model a tariff change or a new duty and see the margin impact before it lands.
The concept
What "tariff exposure" means for a supply chain
Tariff exposure is the share of your landed cost that is duty, plus how much that share moves when trade policy changes. A single HS code and origin country determines the rate; a bill of materials with components from several countries has a blended exposure that is easy to get wrong by hand.
Datastripes computes it from the network: each component carries an HS product and an origin, the duty is looked up, and the calculator rolls it up to the finished product.
How it works
HS product → WITS rate → your cost
Tag components
Each component gets an HS product code and a country of origin.
Look up the duty
Datastripes pulls the applied MFN rate from World Bank WITS and applies any bilateral preference.
Roll up to landed cost
Tariff cost is shown per segment and as a share of total landed cost and margin.
What you can model
Beyond a single lookup
A new or raised duty
Enter a hypothetical rate on a lane and see the landed-cost and margin delta immediately.
A lower-duty origin
Switch a component to an alternative origin and compare duty, freight and lead time.
Multi-origin BOM
A finished product with components from several countries gets one blended exposure figure.
No black box
Every rate shows its WITS source year and type (MFN vs preferential), and its limits.
Limits
What the duty data does and doesn't cover
WITS applied-tariff data covers MFN and many preferential rates at the HS-6 level and is updated on a lag. It does not capture every anti-dumping order, safeguard measure, quota, or same-week policy announcement. Treat the output as a planning estimate and confirm the exact rate with a customs broker before it drives a purchasing decision.
Data and privacy
Nothing you enter is uploaded.
Your supplier list, bills of materials and costs are stored locally in your browser. No account. No upload. Read how that works.
Methods: Monte-Carlo disruption modelling · Leontief input-output cost-push · damped-trend forecasting · safety-stock optimisation. See Methodology & data sources.
Questions
People also ask
- How do tariffs affect my supply chain cost?
- Duty is added to the customs value of each imported component, raising landed cost and cutting gross margin. The effect compounds when tariffed components feed into further tariffed assemblies.
- Where does the duty data come from?
- World Bank WITS applied-tariff data (MFN and preferential rates), matched to each component by HS product code and origin.
- Can I model a tariff that has not taken effect yet?
- Yes. Enter a hypothetical rate on any lane and the calculator re-computes landed cost and margin.
- Is it free?
- Yes, and there is no account. It runs in your browser and nothing is uploaded.
Related
Keep going
Build a BOM and see landed cost, gross margin and margin-at-risk per product.
See tariff exposure that sits two tiers up, not just on your direct imports.
How WITS data is matched and what it covers.
Next step
Calculate your tariff exposure
Your data stays in your device! No account, no upload, no sales call.
Analyse your business chain — it's free!