Free supply-chain risk assessment tool
A live model beats a spreadsheet matrix. Same likelihood × impact framework — but the numbers are computed from your routes, public trade data and disruption history, not typed into a grid.
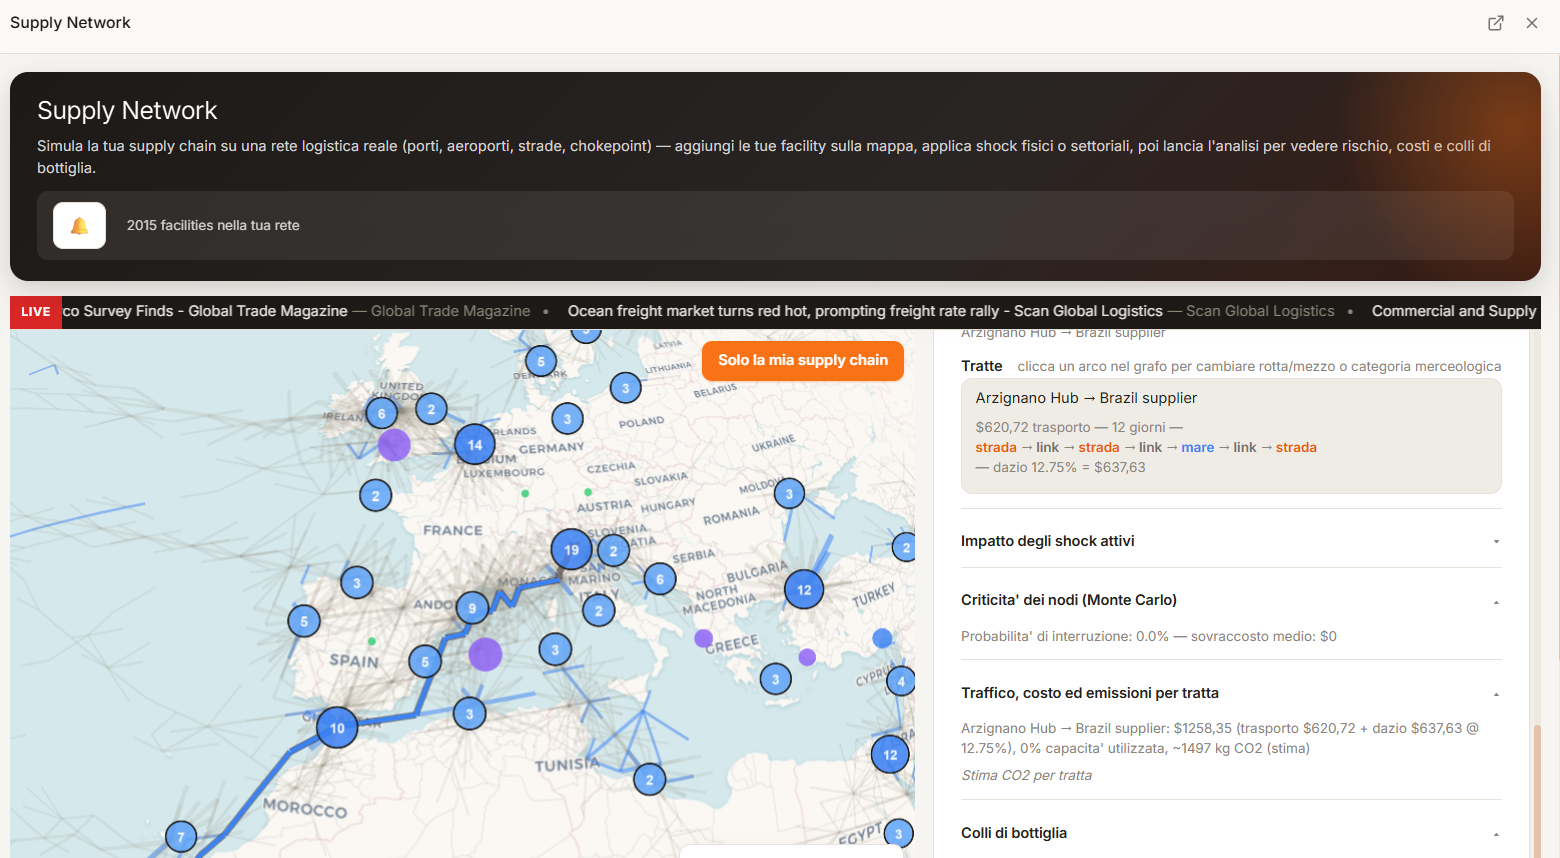
This free supply-chain risk assessment tool runs entirely in your browser. Instead of filling in a risk-assessment template by hand, you build your supplier network once and Datastripes scores five exposure types — disruption, cost, tariff, concentration and compliance — against public data, and ranks the drivers you should act on first.
The question
What a risk assessment should actually answer
A useful assessment answers four things, not one:
- Which suppliers or nodes, if they fail, hurt you most?
- How likely is a disruption over your planning horizon, and how bad?
- Where is your exposure concentrated — one supplier, one country, one route?
- What is the cost and lead-time impact, and what reduces it?
A static matrix records opinions. Datastripes computes these from the topology of the chain you build and the public data behind each factor.
What it scores
The five exposure types
Monte-Carlo risk score
Simulated disruptions across the network return a probability-weighted risk score with the top drivers ranked.
Routed cost model
Cost and lead time routed through every path, so a shock propagates to a real number.
Duty exposure
Applied MFN and bilateral duty on each segment, from World Bank WITS data.
Single points of failure
Herfindahl index, country share and single-source count across the base.
Sanctions & forced labour
A first-pass screen against the US BIS Entity List and UFLPA forced-labour lists.
Step by step
From supplier list to risk score
Add or import suppliers
Enter suppliers, sites and lanes, or import a CSV. Everything stays on your device.
Run the assessment
Datastripes routes the model, runs the Monte-Carlo simulation and scores each exposure type.
Read the drivers and act
Work the ranked list — add a backup source, re-route, buffer stock — then re-run to confirm the score fell.
Compare
Template vs a live model
| Risk-assessment template | Datastripes | |
|---|---|---|
| Inputs | Typed-in opinions | Your routes, costs and public trade data |
| Likelihood | A guess on a 1–5 scale | Monte-Carlo simulation over the network |
| Impact | A guess on a 1–5 scale | Cost and lead-time delta, routed |
| Update | Re-typed each quarter | Re-run in seconds after any change |
| Cost | Free | Free, no signup |
Data and privacy
Nothing you enter is uploaded.
Your supplier list, bills of materials and costs are stored locally in your browser. No account. No upload. Read how that works.
Methods: Monte-Carlo disruption modelling · Leontief input-output cost-push · damped-trend forecasting · safety-stock optimisation. See Methodology & data sources.
Questions
People also ask
- How do you do a supply-chain risk assessment?
- Map your suppliers, sites and routes; identify which nodes are critical; estimate likelihood and impact of disruption; and prioritise mitigations. Datastripes automates the middle two steps from the network you build.
- Is there a supply-chain risk assessment template?
- Datastripes replaces the template with a live model: you get the same likelihood × impact structure, but the numbers are computed rather than typed.
- How is the disruption-risk score calculated?
- By Monte-Carlo simulation: disruptions are sampled across the network and propagated through the routed cost and lead-time model, producing a probability-weighted score. Assumptions are shown on screen.
- Does it cost anything?
- No. The assessment is free and runs in your browser with no account.
Related
Keep going
Find the single points of failure and country concentration in your supply base.
Run 100+ disruption scenarios and see cost and lead-time impact before an S&OP review.
How the Monte-Carlo model, input-output cost-push and data sources work.
Next step
Run your assessment now
Your data stays in your device! No account, no upload, no sales call.
Analyse your business chain — it's free!