Shipping chokepoint risk on your supply chain
Which of your routes pass through the Suez Canal, the Panama Canal, the Strait of Hormuz, Bab-el-Mandeb or the Strait of Malacca — and what a closure would cost you.
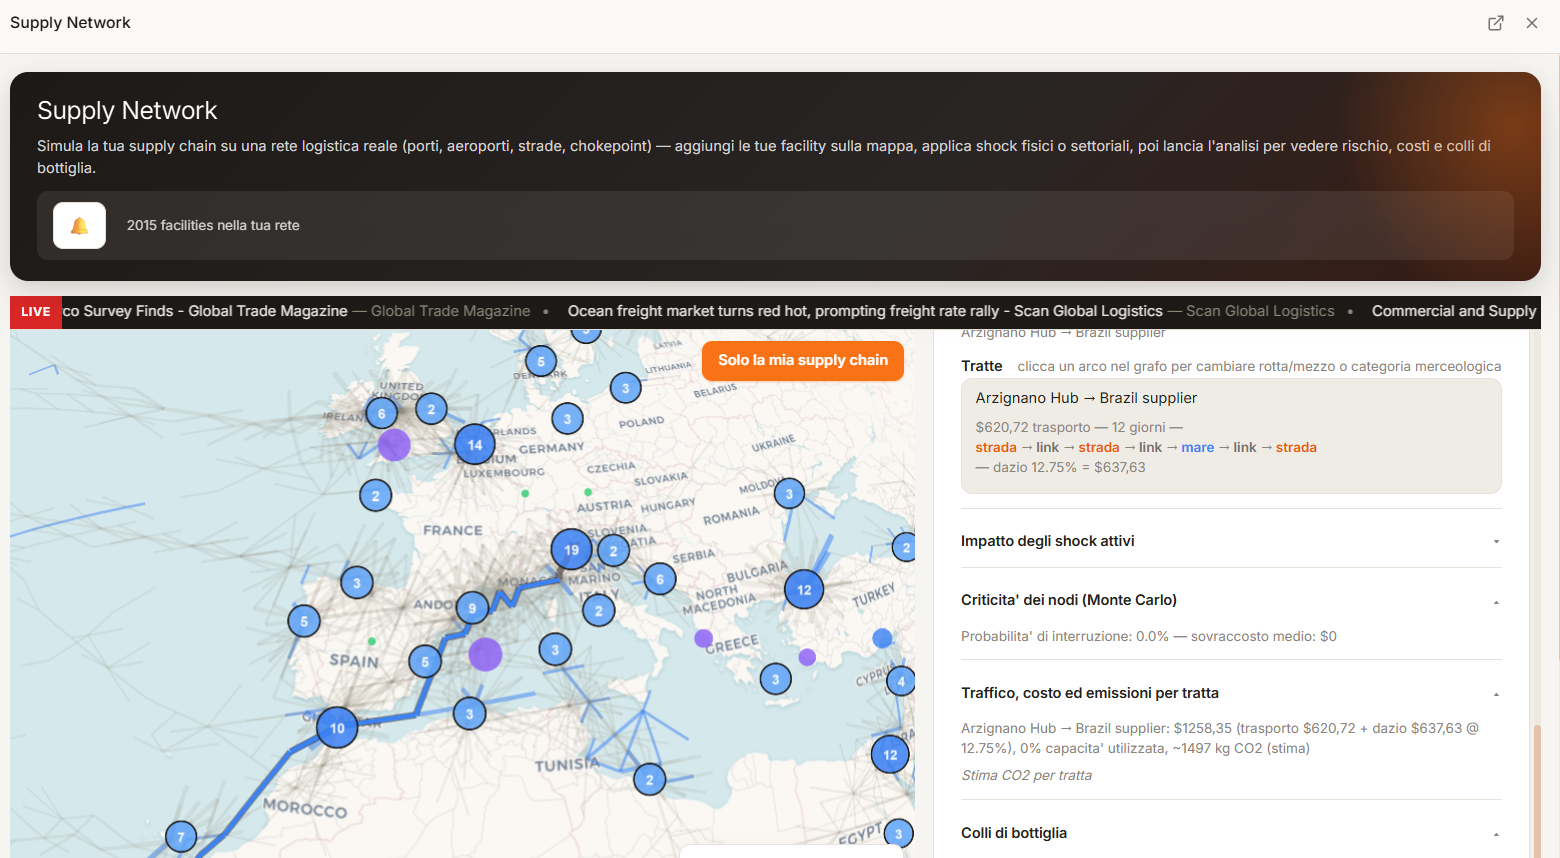
This chokepoint risk tool runs in your browser. Datastripes checks your shipping routes against the eight maritime chokepoints that carry most of world trade, shows current vessel transits against baseline from IMF PortWatch, and lets you model a closure to see the cost and lead-time impact on your specific chain.
Background
What a chokepoint is, and the eight that matter
A chokepoint is a narrow passage that a large share of maritime trade cannot avoid: the Suez Canal and Bab-el-Mandeb, the Panama Canal, the Strait of Hormuz, the Strait of Malacca, the Turkish Straits, the Danish Straits and the Cape of Good Hope as the fallback around Africa.
When one constricts — drought at Panama, attacks in the Red Sea — traffic reroutes, transit times jump and rates spike. The question for your chain is simple: how much of your volume goes through the affected passage?
What you see
Per chokepoint, and per your route
Current vs baseline
Vessel-transit counts against a baseline for each chokepoint, from IMF PortWatch, with recent disruptions noted.
Routes flagged
Datastripes detects which of your loaded routes pass through each chokepoint and how much cost and volume that represents.
Cost and lead-time delta
Apply a closure or slowdown and the routed model returns the impact on affected products.
Reroute, buffer, mode shift
Compare an alternate routing, a stock buffer or an air-freight fallback on cost and time.
How it works
Detect, then model
Load your routes
Origin, destination and mode for each lane. Stored on your device.
Match chokepoints
Datastripes maps each sea route to the chokepoints it crosses and pulls PortWatch transit data.
Apply a scenario
Close or throttle a chokepoint and read the cost and lead-time impact on your chain.
Data and privacy
Nothing you enter is uploaded.
Your supplier list, bills of materials and costs are stored locally in your browser. No account. No upload. Read how that works.
Methods: Monte-Carlo disruption modelling · Leontief input-output cost-push · damped-trend forecasting · safety-stock optimisation. See Methodology & data sources.
Questions
People also ask
- How do I know if my supply chain is exposed to the Suez Canal or Strait of Hormuz?
- Load your shipping lanes into Datastripes; it maps each sea route to the chokepoints it crosses and shows the share of your cost and volume that depends on each one.
- What data shows whether a chokepoint is disrupted?
- IMF PortWatch publishes near-real-time vessel-transit counts against a baseline for major chokepoints and ports. Datastripes displays current vs baseline per chokepoint.
- Can I estimate what a Red Sea diversion costs me?
- Yes. Apply a Bab-el-Mandeb / Suez closure scenario and the routed model reroutes affected lanes around the Cape of Good Hope and returns the added cost and days.
- Is it free?
- Yes, and no signup. It runs in your browser.
Related
Keep going
Stack a chokepoint closure with other shocks and see the combined trajectory.
Find chokepoint exposure that sits on your suppliers' routes, not just yours.
How PortWatch data and route matching work, and the update cadence.
Next step
Check your chokepoint exposure
Your data stays in your device! No account, no upload, no sales call.
Analyse your business chain — it's free!